01 / 05
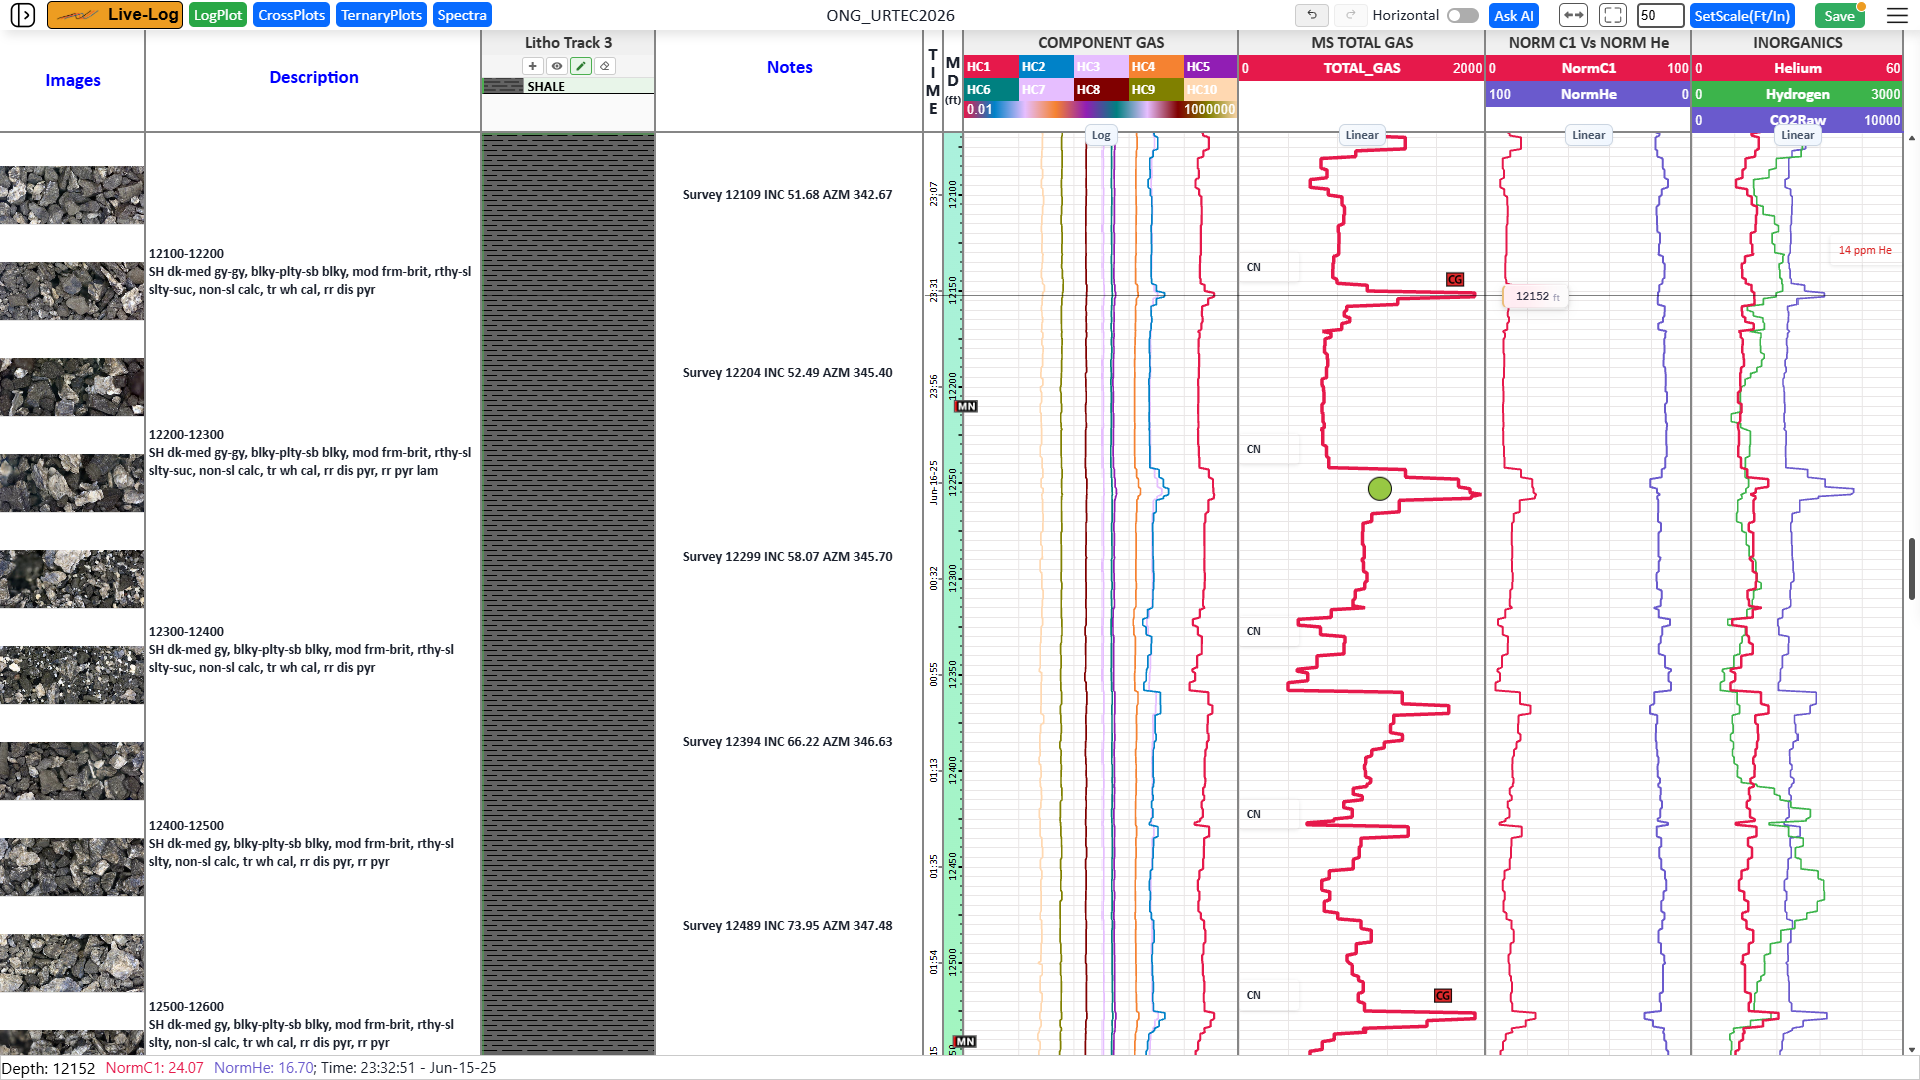
Vertical depth logs
Gas curves, lithology, notes and core images side by side, fully configurable and indexed to depth.
Live-Log ties the field and the lab together, streaming, integrating, and visualizing it all in one place, in the cloud or on the desktop.
Live-Log is the software that ties the field and the lab together, streaming, integrating, and visualizing it all so you can interpret the well in real time. Run it in the cloud for remote teams, or as a desktop app that works with no internet on remote wellsites.
Gas curves, lithology, notes and core images side by side, fully configurable and indexed to depth.
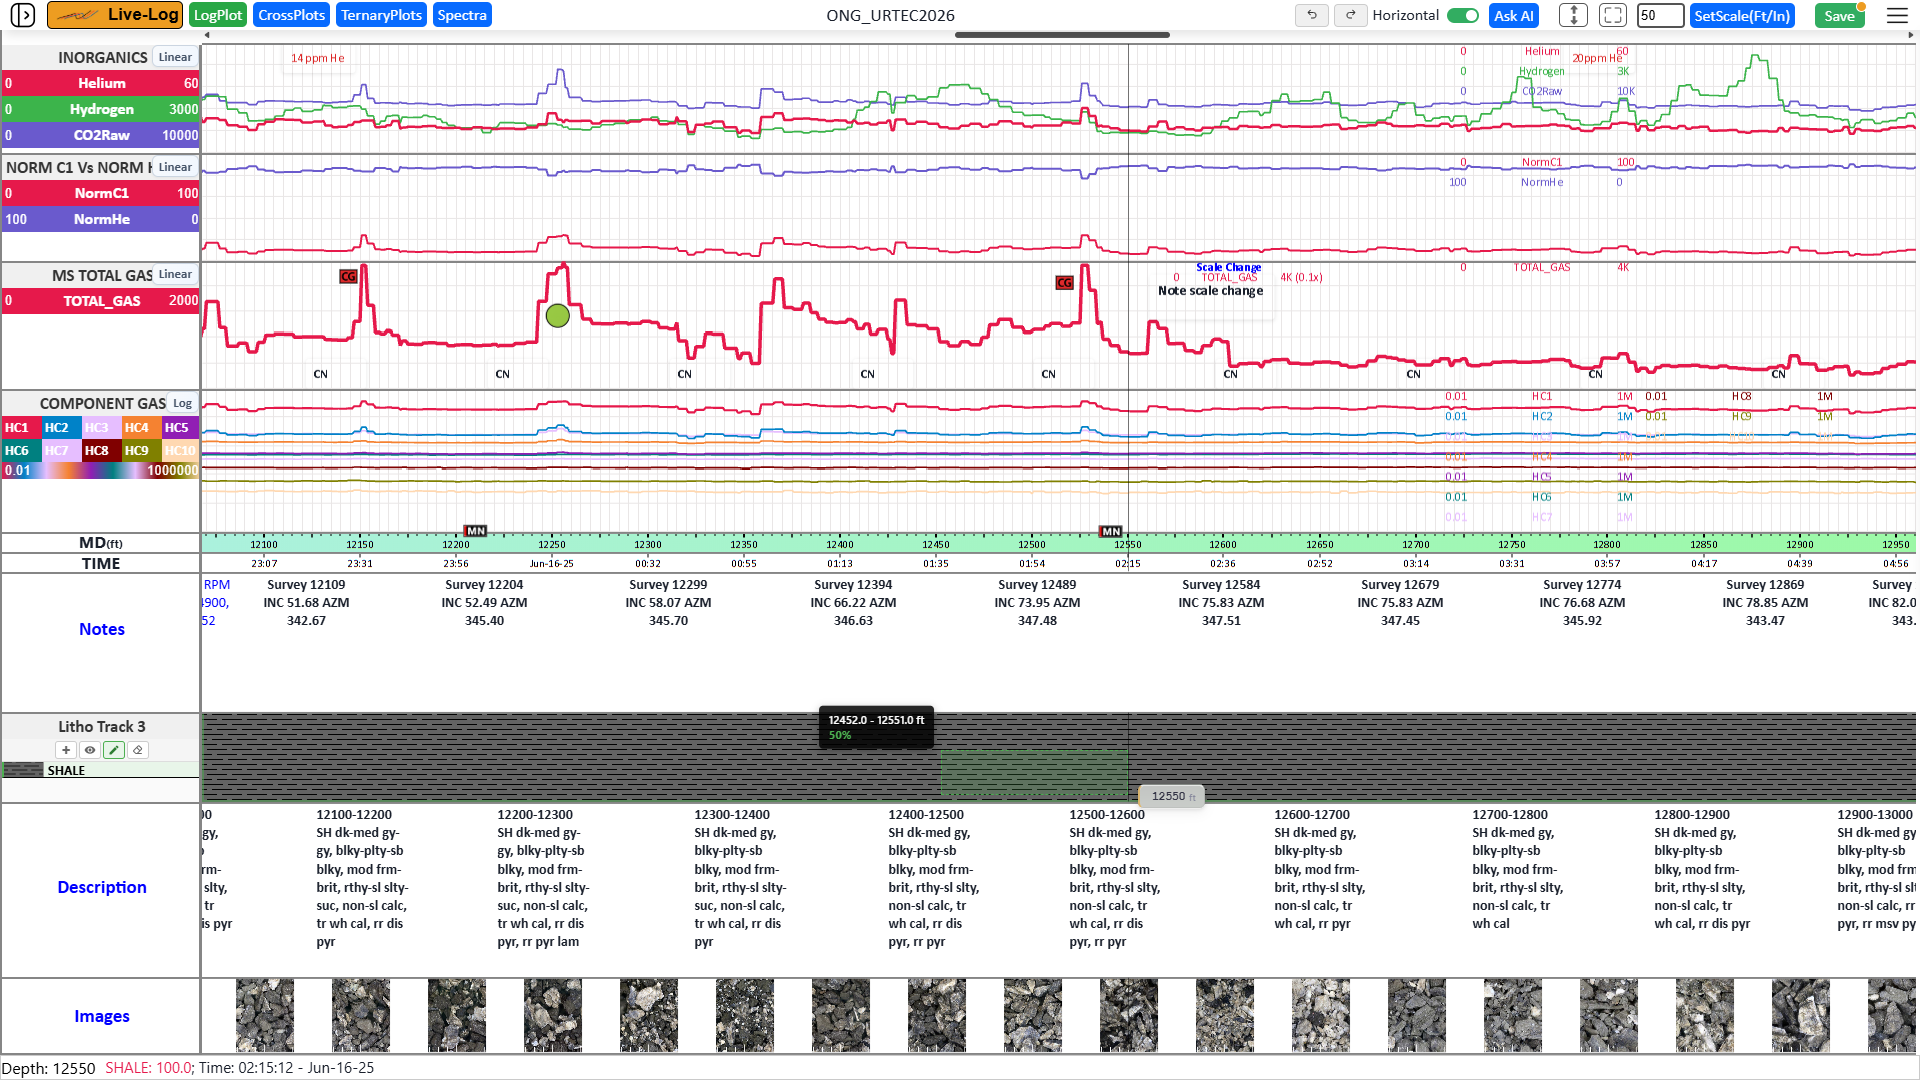
One click flips the whole log to a horizontal orientation, with scaling and fit preserved.
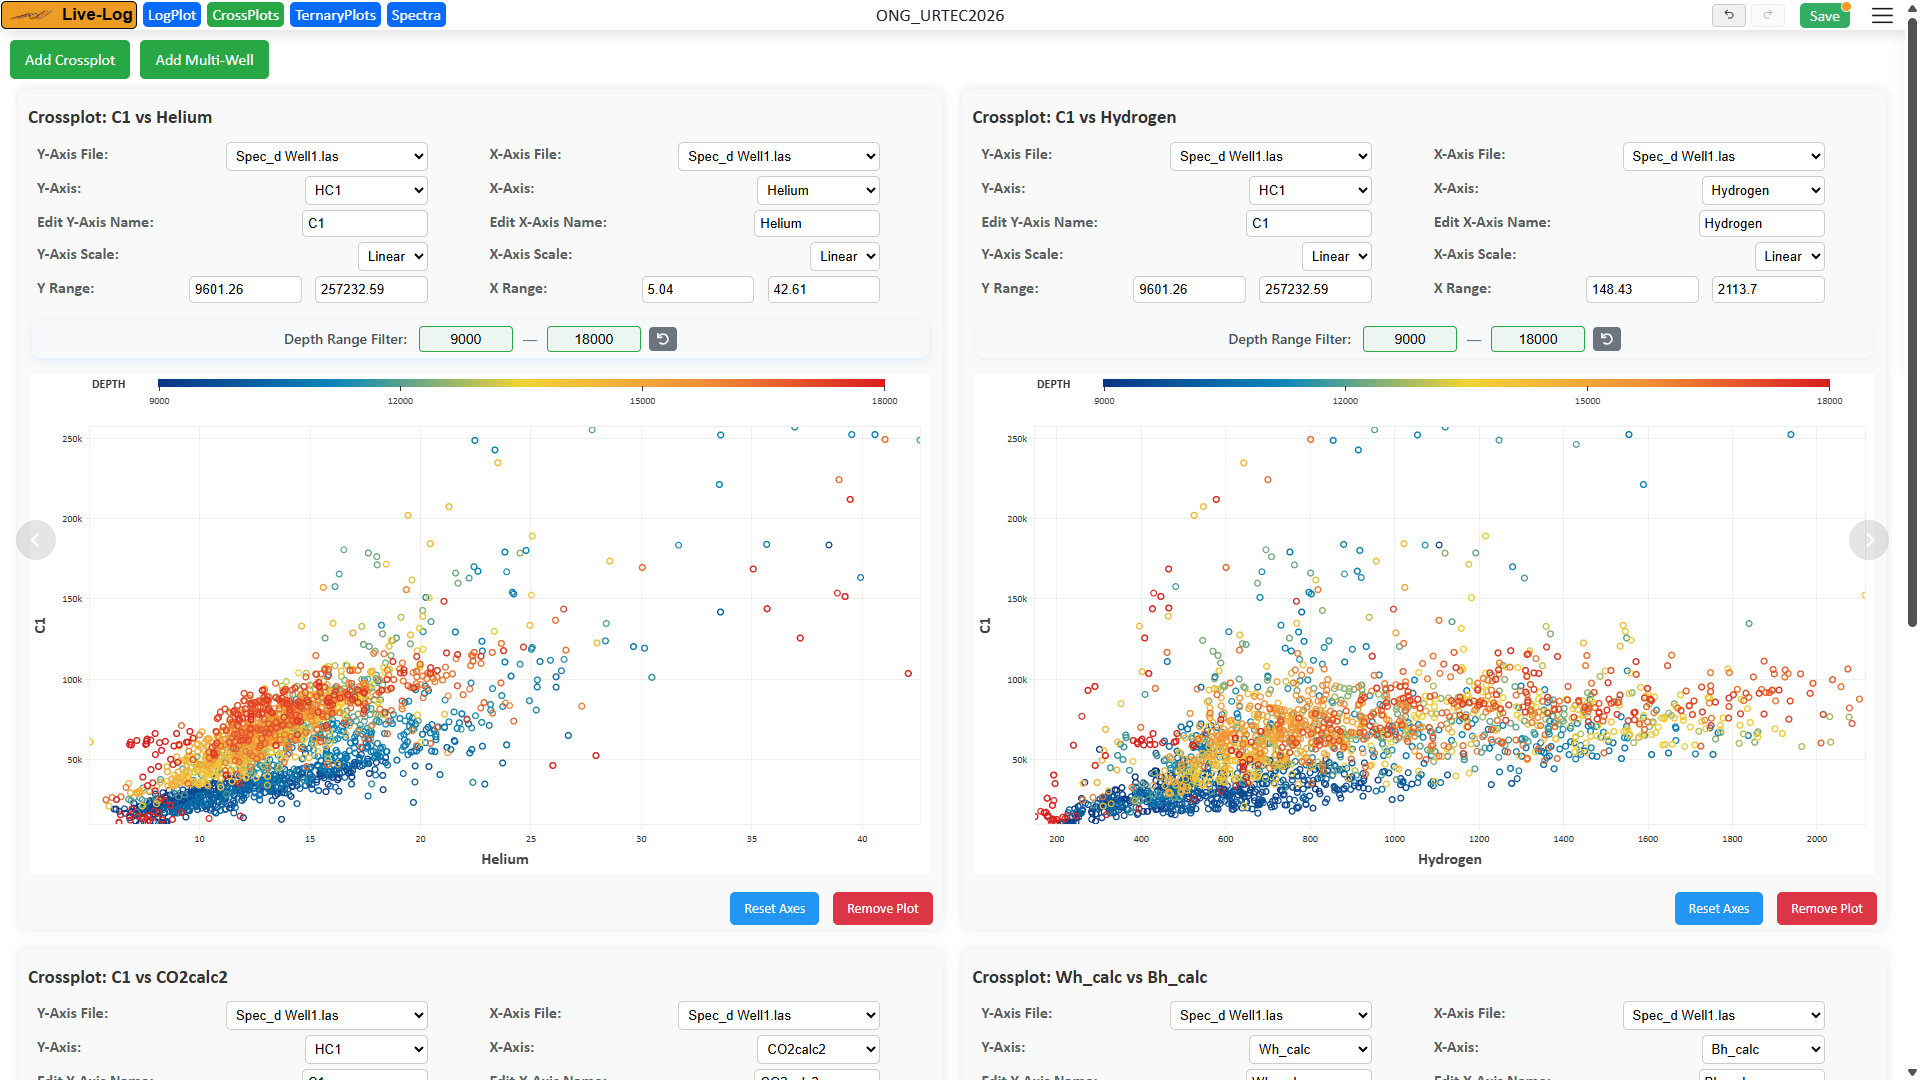
Plot any channel against another, C1 vs helium, hydrogen, CO₂ and more, colored by depth and filtered by range.
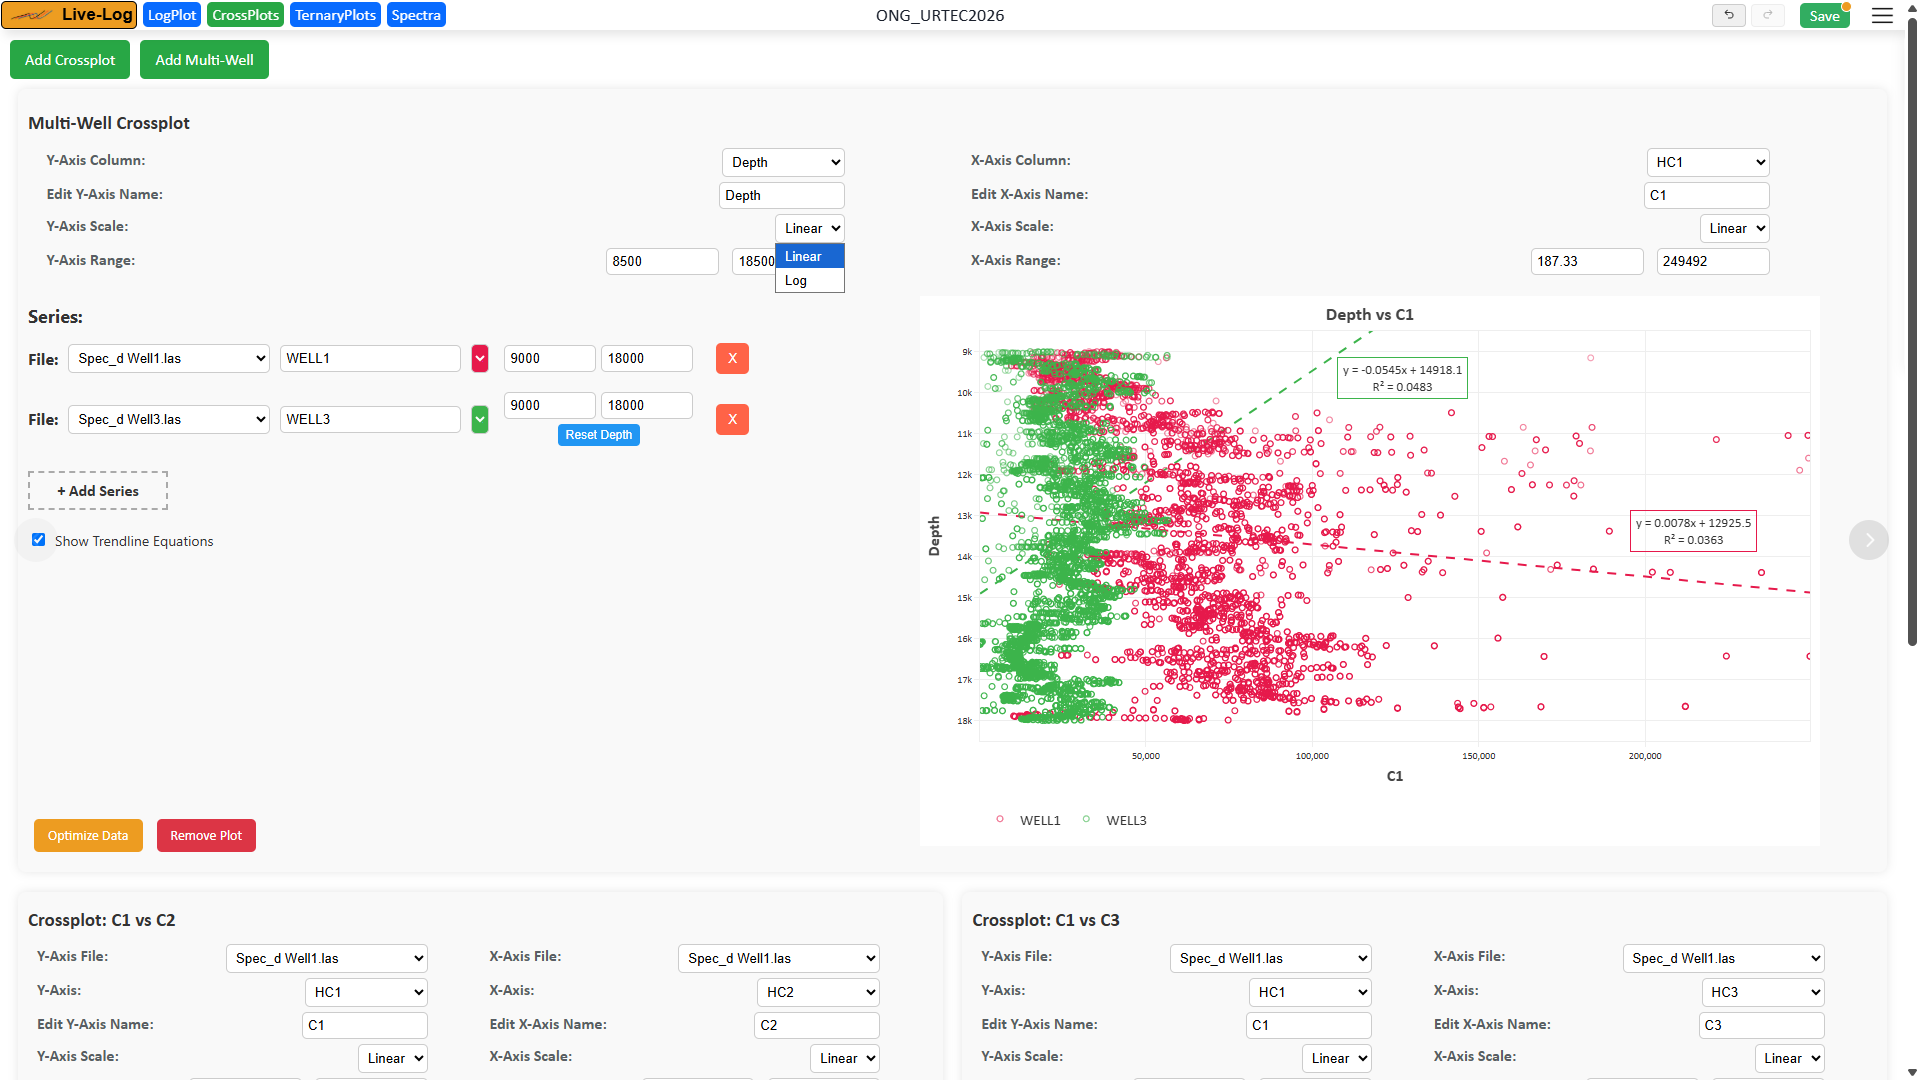
Overlay multiple wells on one crossplot with trendline equations to correlate across the field.
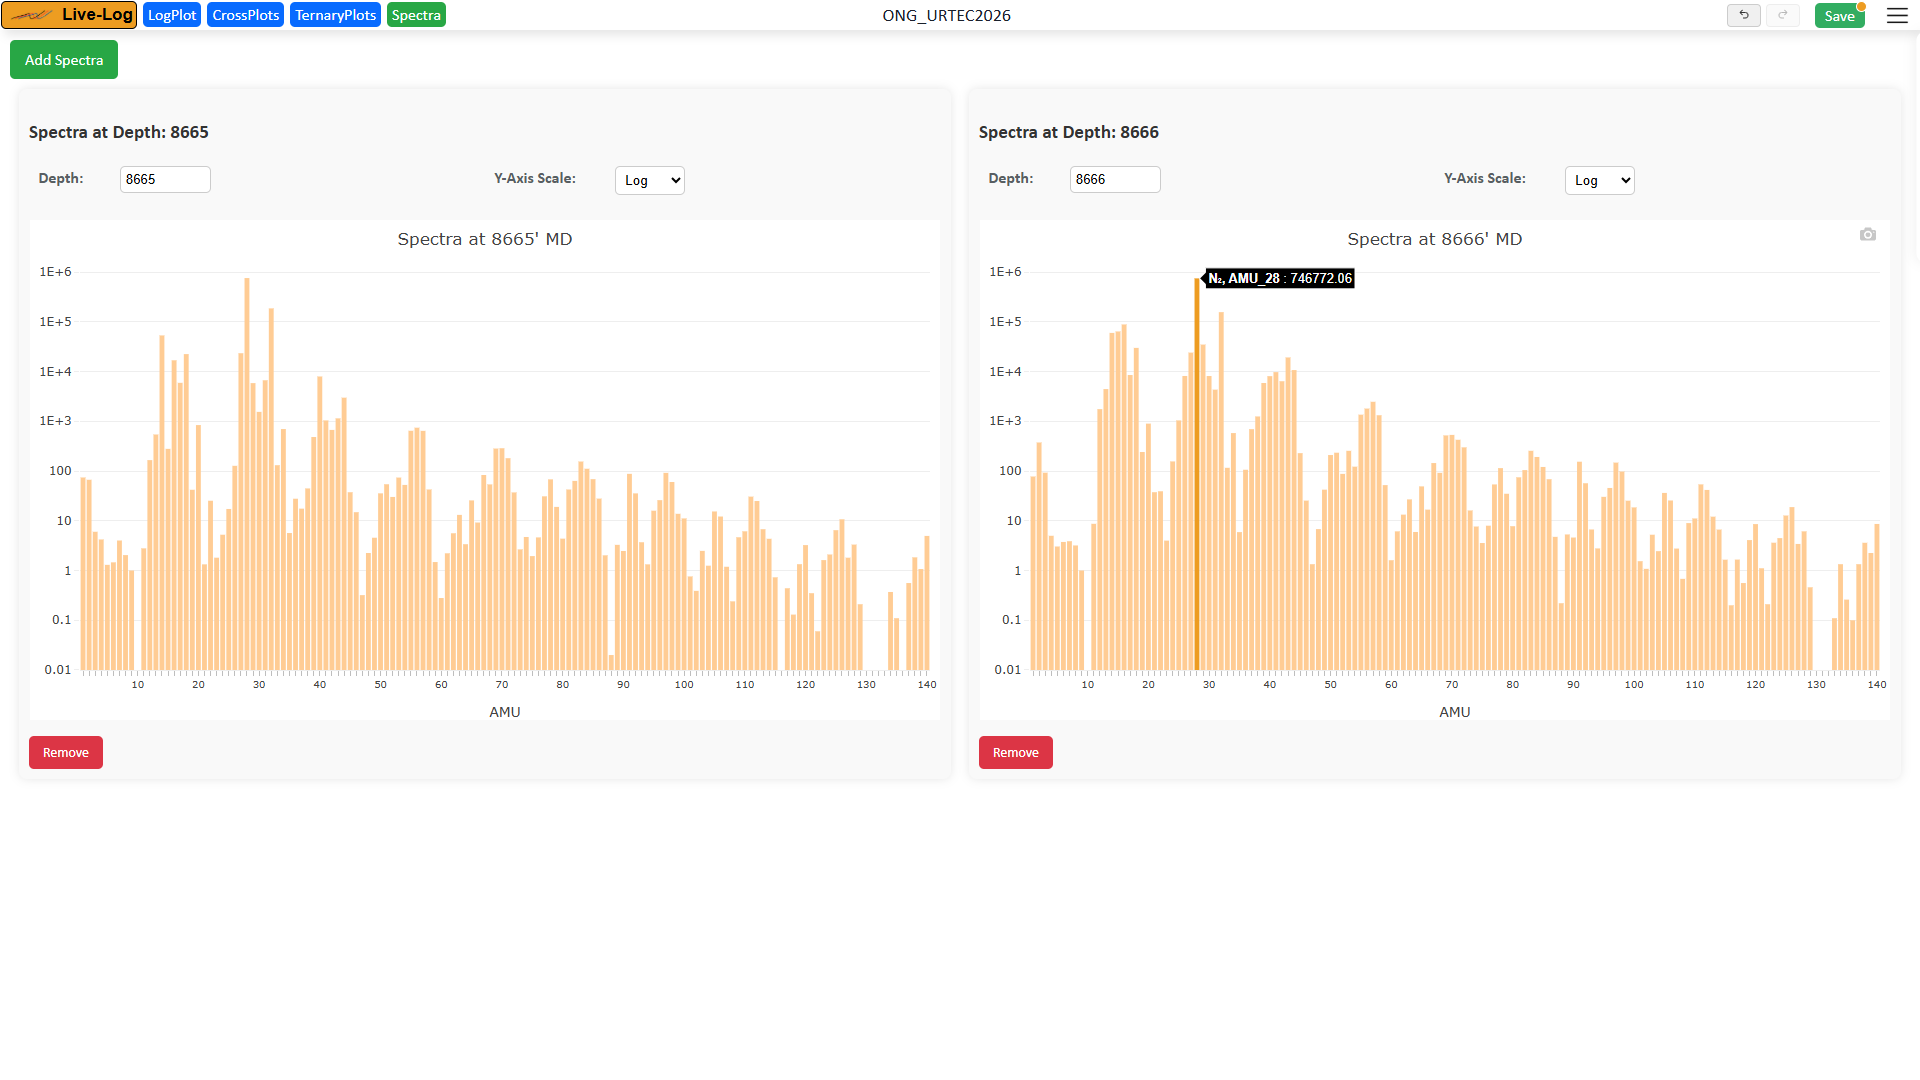
Inspect the full 2 to 140 amu spectrum at any depth, straight from the Spec mass spectrometer.
Rigs lose connectivity. Live-Log runs as a native desktop application that works fully offline, so logging never stops, then syncs to the cloud for your remote team the moment you are back online.
Install and run it on the wellsite machine. Full plotting, notes, exports and reports with no connection required.
Stream and share the live well with the office and clients, with secure remote access from anywhere.
Stream every instrument to a live, depth-indexed log as the well is drilled.
One-click toggle between orientations, with chart scaling, drag-to-reorder tracks, templates, and image tracks for cuttings and core.
Interactive crossplots (C1 vs He, H₂, CO₂ and more) with depth filtering, plus multi-well crossplots with trendline equations.
Inspect the full 2 to 140 amu mass spectrum at any depth, alongside ternary lithology plots, straight from Spec.
Auto-flag significant gas peaks, drag-and-drop notes with templates, plus point, compartment, litho and image tracks.
Real-time WITS in, LAS out, with automated daily and end-of-well reports and AI-assisted interpretation, exported to PDF.
Clients can ask questions and get answers right on the log, with shared cloud access for the whole team.
Our software is developed in house. Tell us the workflow you need and we will build it into the platform.
From the first cutting to the final report, Live-Log keeps the whole well in view.