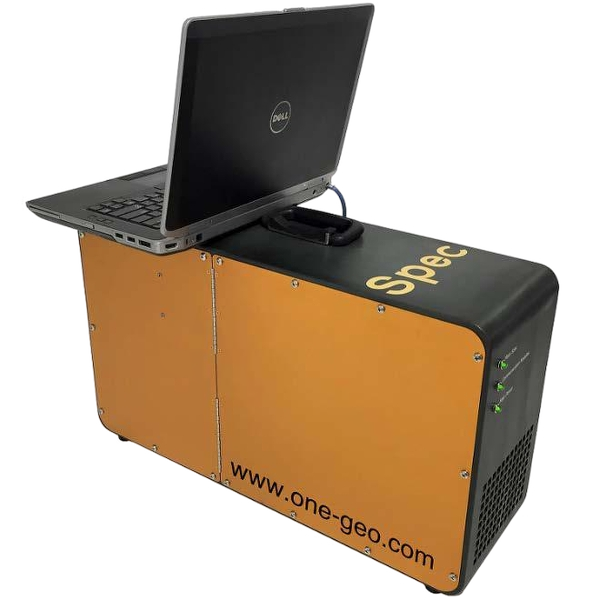
The mass spectrometer built for the wellsite.
Spec is a fully automated, continuous-flow gas analyzer that reads formation fluids straight out of the drilling mud. The flagship of our wellsite gas-analysis suite, it correlates comprehensive gas data with drilling parameters over WITS to build a real-time depth profile of your well. Deployed globally.
Formation evaluation, straight from the drilling mud.
Mud-gas analysis reads the formation fluids entrained in drilling mud while drilling. It is one of the most cost-effective pieces of information available for formation evaluation.
 SPEC · FIELD UNIT WITS LIVE40 s cycle2–140 amu
One box. The full gas picture, every 40 seconds.
Spec is a mass spectrometer designed specifically for wellsite mud-gas analysis in real time. As a fully automated continuous-flow analyzer, it collects comprehensive gas data and correlates it with drilling parameters received over WITS to create a live depth profile of the well.
Its easy setup, standalone and robust design, and minimal oversight requirements make it the ideal choice for gas analysis on any pad, in any basin.
- Fully automated
- Continuous flow
- WITS integrated
- Standalone & robust
- Easy setup
- Minimal oversight
From exploration to production, conventional to unconventional.
One continuous gas record answers questions across the entire life of the asset, and across every kind of resource play.
- 01Reservoir
Petroleum type & quality
Geochemical fingerprinting across exploration, development, and production wells.
- 02Reservoir
Fluid contacts & pay proximity
Locate fluid contacts, near-miss zones, and water saturation in real time.
- 03Reservoir
Porosity, permeability & fractures
Characterize porosity and permeability, and map faults and fracture networks.
- 04Reservoir
Compartmentalization & seals
Identify compartment boundaries, sealing intervals, and low gas shows.
- 05Reservoir
Reservoir fluid composition
Compositional data that correlates directly with laboratory PVT analysis.
- 06Operations
Sweet spots & geosteering
Spot sweet spots in unconventionals with potential for real-time geosteering.
- 07Operations
Improved well completions
Compositional depth profiles inform stage placement and completion design.
- 08Operations
Bit wear detection
Gas signatures reveal bit wear before it becomes a costly trip.
- 09Safety
Overpressure detection
Early warning of overpressured zones while drilling ahead.
- 10Safety
Problem gas detection
Track sulfur species like SO/SO₂, COS, CS₂, and H₂S before they become hazards.
- 11Specialty
Geothermal wells
Full inorganic gas analysis suited to geothermal exploration and development.
- 12Specialty
Helium wells
Direct helium measurement at mass 4, with no chromatography required.
Everything a chromatograph does. Plenty it can’t.
No chromatographic separation, no carrier gas, no calibration gas, no combustion. Just a complete gas picture from mass 2 to 140.
Total gas and C1–C10, with the aromatics GC misses
- Total gas and C1–C10 hydrocarbons, measured continuously.
- Distinguishes alkanes, cycloalkanes, and aromatics.
- BTEX compounds: benzene, toluene, ethylbenzene, xylene.
- Water-soluble organic acids, including acetic acid.
- Standard gas ratios computed live: Pixler, wetness, balance, character.
How often you measure decides what you can see.
Gas rises to surface with the drilling mud, and an analyzer measures it. Cycle time is how long one measurement takes. The bit keeps drilling while it runs, so a slower analyzer has to cover more rock with every reading. Pick a drilling speed, then drag the slider: same rock, different analyzers.
Thin gas zones are being smeared away. A reading now lands only every 4 ft, so they merge into their neighbors and stop showing up as separate finds. Each ⊘ marks one.
Real log data, plus illustrative zones. Uinta Basin · Duchesne Co., UT · 700 ft, recorded on a Spec at 39 s, one reading every 1.46 ft. Twelve thin gas zones were added so the resolution loss has something to act on; everything else is as recorded.
A missed zone is a missed pay interval. You cannot steer toward gas the log never showed you. The Spec holds the fastest full-spectrum position in the industry: every gas species on the log, every 40 seconds, at any drilling speed.
Lab-grade analysis in a 45-pound box.
Small enough to ride in a pickup, tough enough for the pad, connected enough to watch from the office.
- Dimensions
- 24″ × 7.5″ × 14″
- Weight
- 45 lbs
- Power
- 100–240 VAC, 50/60 Hz
- Cycle time
- 40 s
- Mass range
- 2–140 amu
- Dynamic detection range
- 100% to 10 ppb
- Telemetry
- WITS enabled · internet connected
- Data output
- LAS file + real-time WITS stream
- Relay I/O
- Three 24 VDC relay inputs and outputs
- Sensor input
- One 4–20 mA external sensor input
- Sample flow required
- 2 scfh (1 lpm), clean and dry
Data profile viewable onsite and remotely · output as LAS file and real-time over WITS